
Ghost Beds
Hospital delivery structure is quietly reducing Canada's care capacity

Executive Summary
Does Canada’s reliance on public-private partnerships (PPP) deliver the healthcare capacity we pay for? The evidence says no.
Independent public-sector audits in Canada and comparable jurisdictions find that a public-private partnership delivery carries a material capital and lifecycle cost premium, conservatively estimated at ~26 percent, compared with traditional public delivery.¹²³
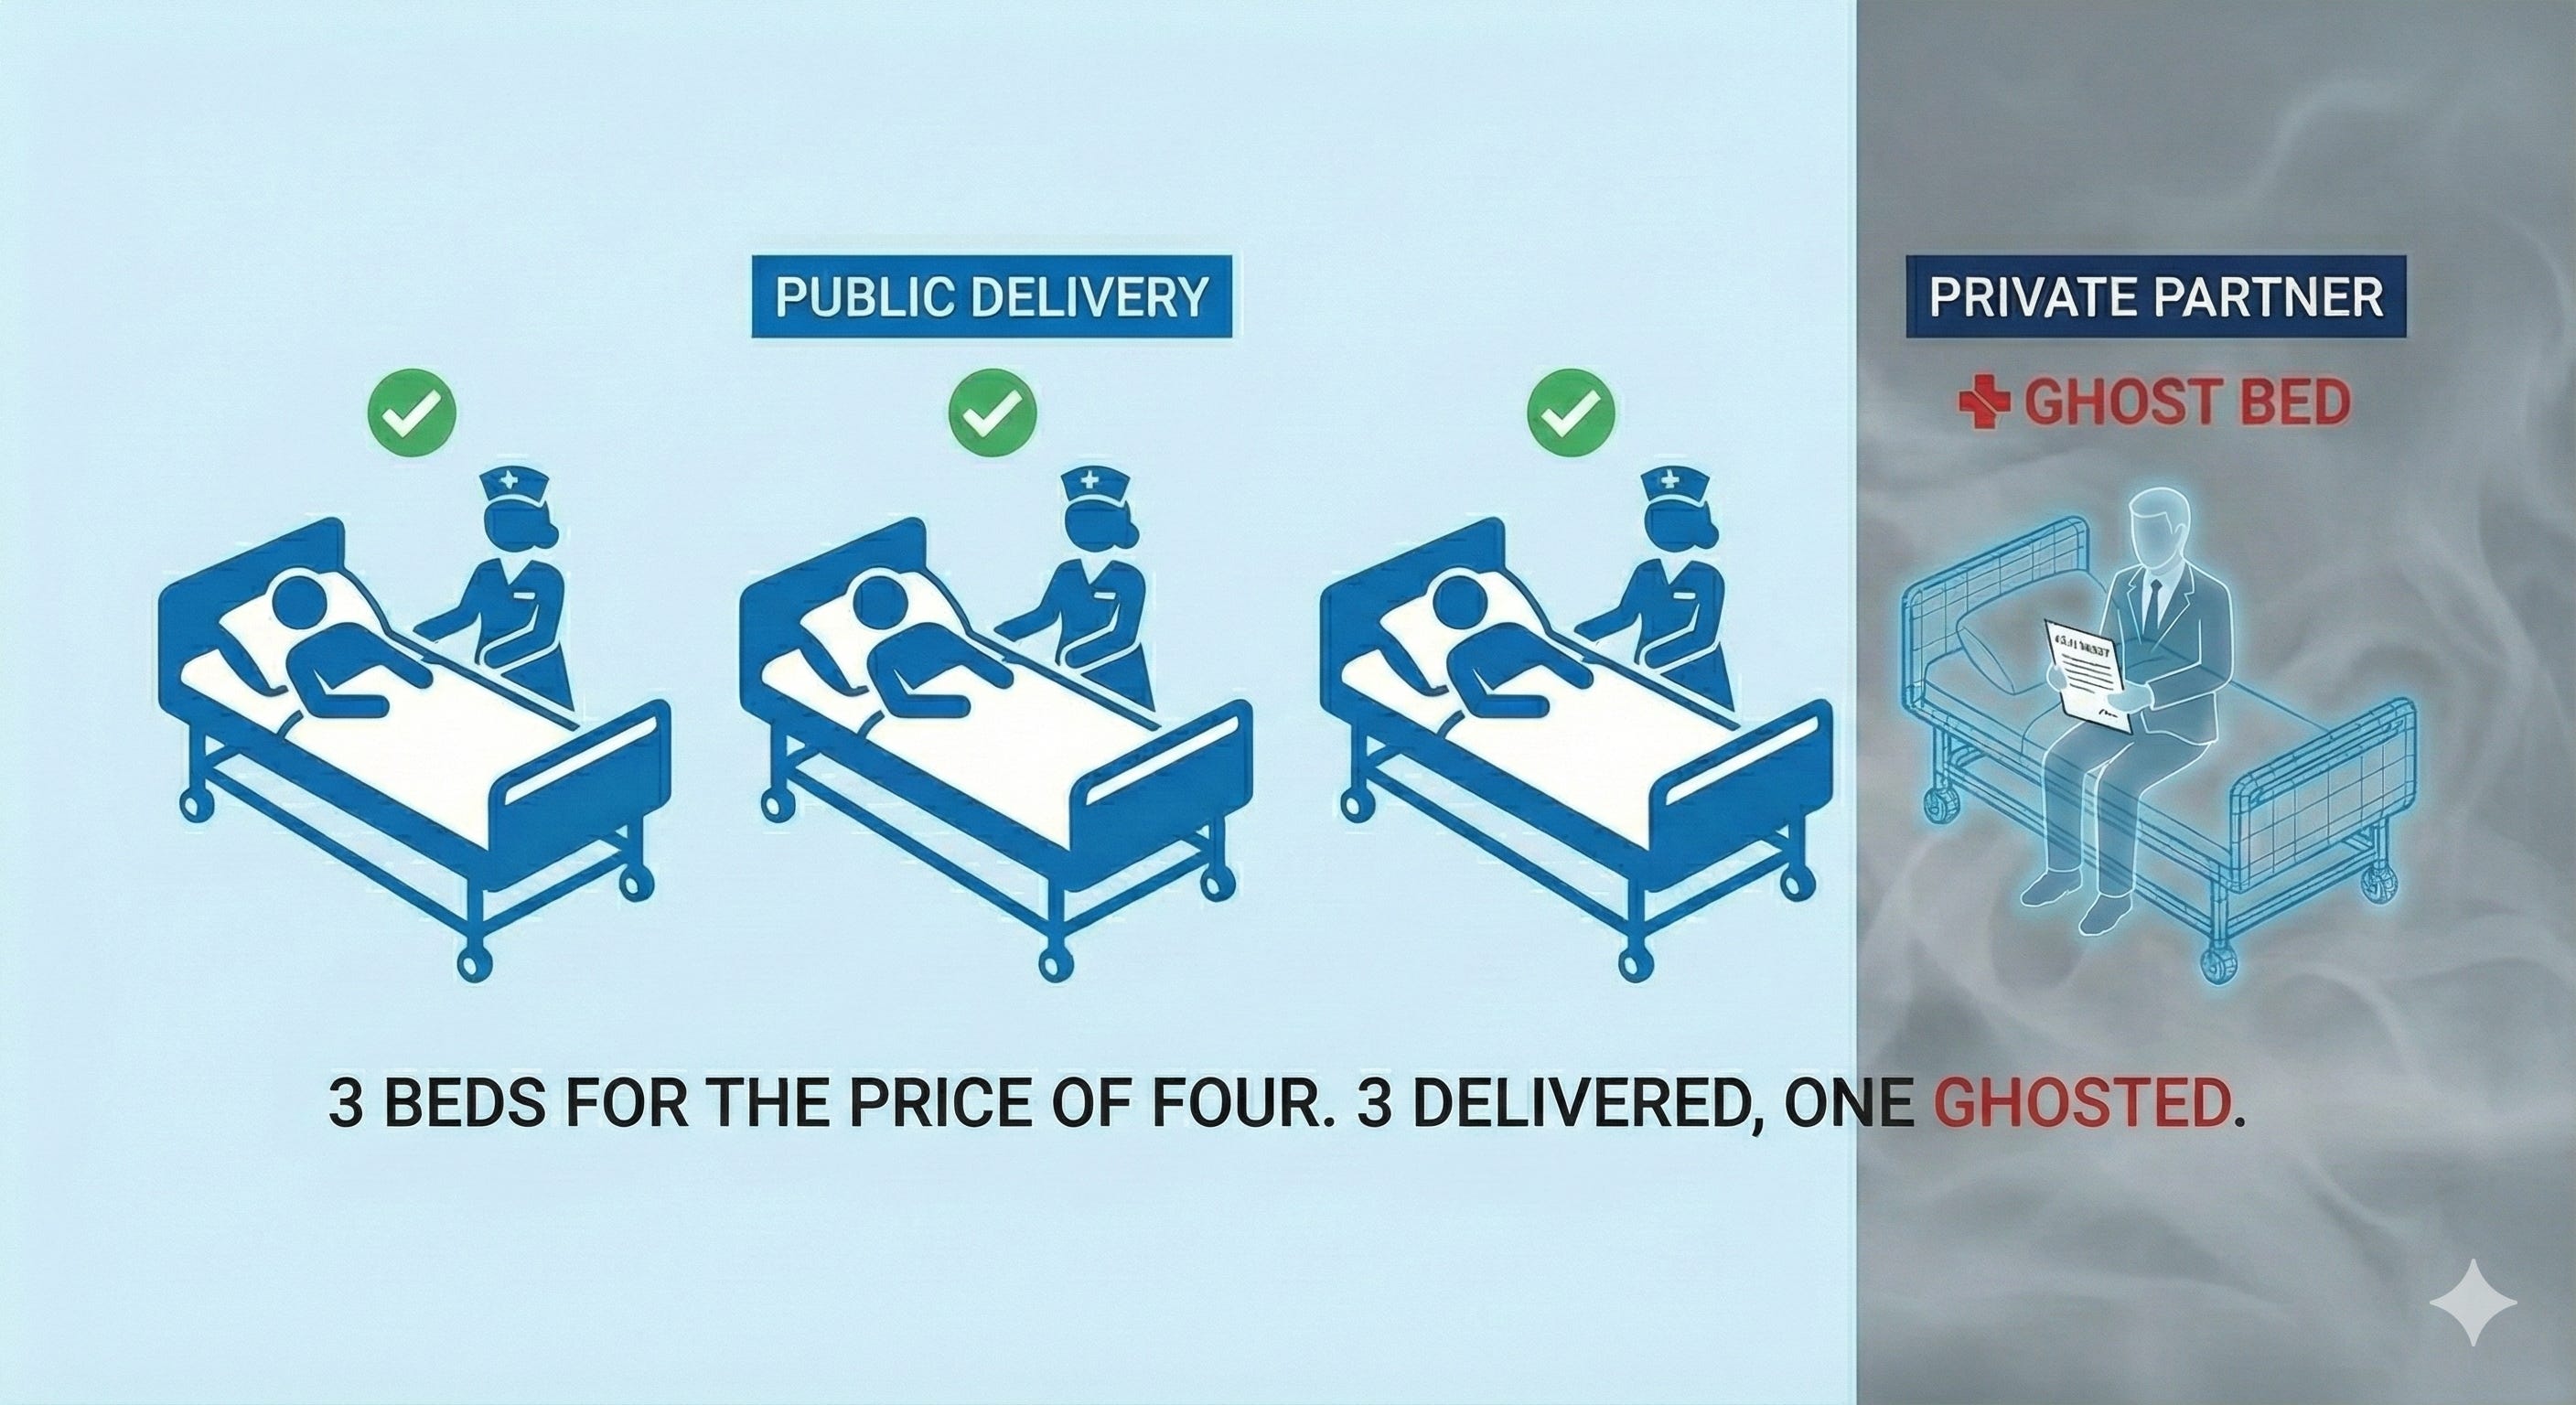
That premium has an unavoidable direct consequence: fewer hospital beds are built for the same scarce public money. Private-partnership models deliver three beds for the cost of four.
This means that 1,300~1,500 fewer beds⁴ exist today than might have under conventional delivery. This is equivalent to the total bed capacity of 3-4 major Canadian hospitals simply missing from our system today. Or nearly a dozen community hospitals.
This is based on hospital beds delivered or committed for delivery under private-partner models so far and reflects conservative adjustments for incomplete disclosure, phased projects, and partial scopes (see Appendix A1 for a documented minimum list).
Canada would forgo a similar number of beds again, if the current pipeline of projects is delivered under the same structures.⁵
Beyond fewer beds, private partnership introduces long-term structural rigidity into the healthcare system. Fixed contractual “availability payments” are recurring claims on health-sector fiscal room each month over decades. They protect the physical asset and necessarily reduce what remains available for discretionary operating allocations and flexibility for patient care over time.
When healthcare budgets tighten—as they inevitably do—reductions occur in discretionary areas such as staffing, funded beds, and surge capacity, not in the fixed contract obligations.⁶⁷ Leaving beds without staff and unavailable for care.
The effects compound: first fewer beds are built, then professional staff are forced to manage the resulting overcapacity. This reduces the ability to safely staff, adapt, and surge the few beds we have—often when they are most needed.
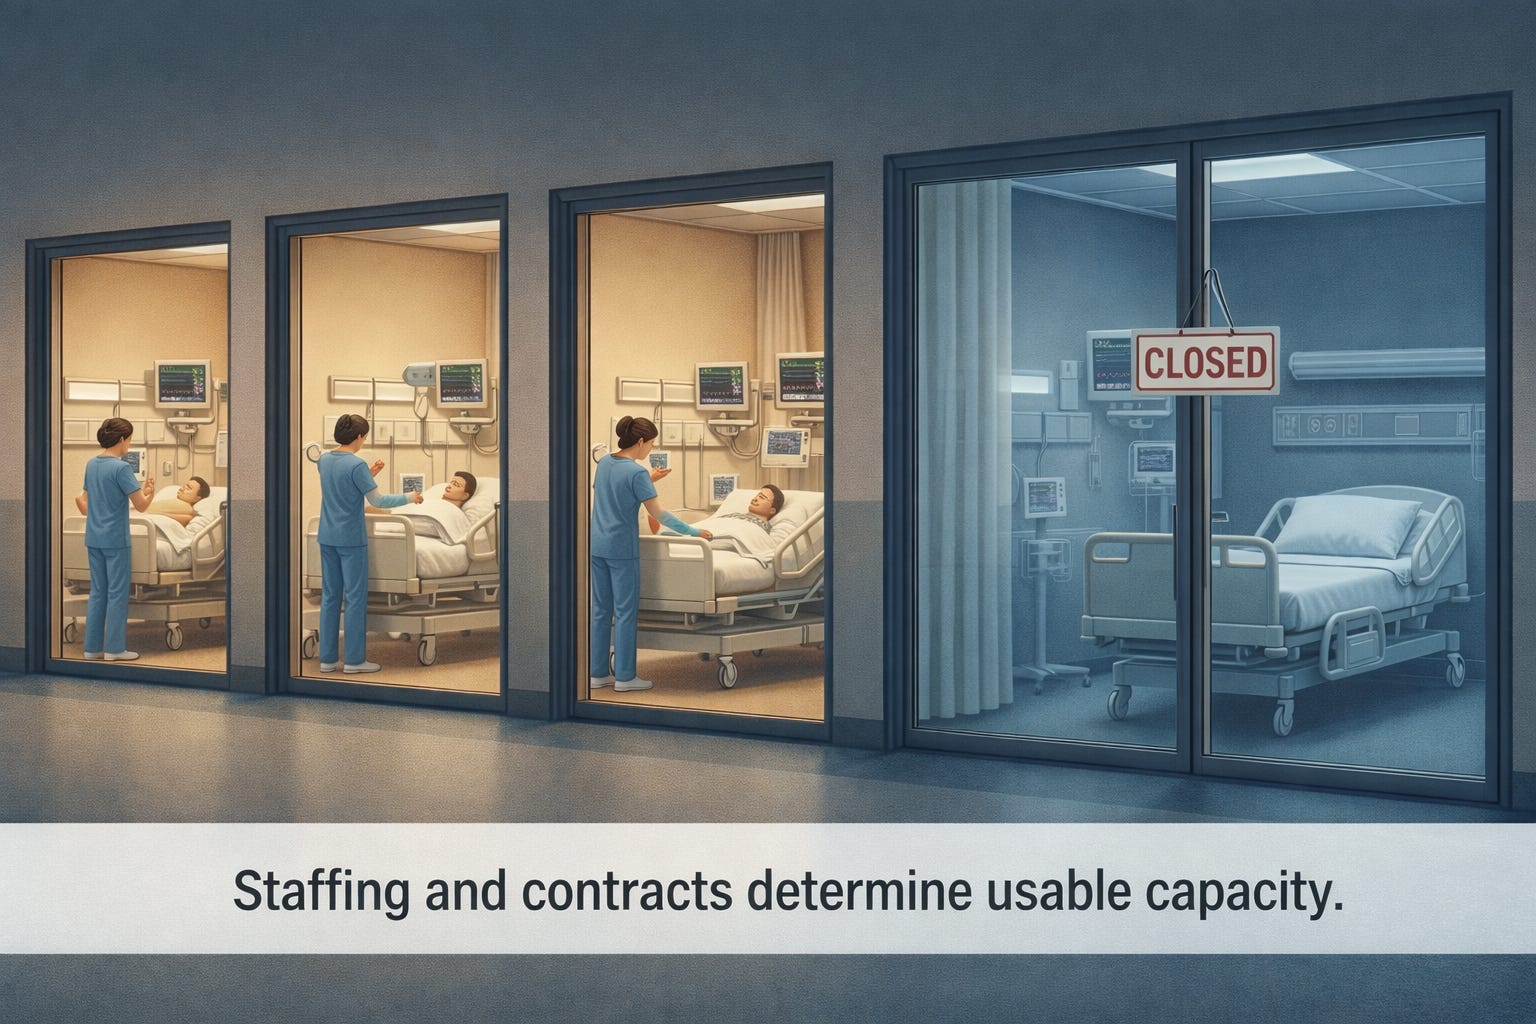
These are the “ghost beds” of Canada’s hospital system—some never existed, and others are real in plans and buildings, yet unavailable for patients.
Evidence shows that privately partnered hospitals deliver fewer beds, with less availability and flexibility.
Introduction
This paper examines a simple, measurable question:
When Canada builds hospitals using public-private delivery models, do we get the same healthcare capacity for the same public money?
Based on completed projects and current plans, the answer is no.
What we get instead is a structural reduction in capacity—fewer hospital beds for the same scarce public dollar—combined with a loss of flexibility that becomes most damaging precisely when patients and healthcare systems are under stress.
This is not an ideological argument about public versus private healthcare delivery. It is a practical examination of how hospital delivery and long-term management structures behave under real conditions when they intersect with essential public services and patient care.
Canadian healthcare delivery is largely a provincial responsibility. The dynamics described here appear across time, provinces, and political contexts. This is not about politics; it is about how hospitals are financed and governed, and what that means for the public as patients.
What We Have Done
Over the past two decades, Canada has increasingly relied on private-partner hospital delivery models—commonly described as PPP, AFP, or DBFM—to build major hospital infrastructure.⁸
Canada has now used this approach for dozens of hospitals nationwide. Approximately 5,000–6,000 beds have been delivered or contractually committed under private-partner structures.¹¹
Governments adopted these models for understandable reasons: the promise of on-time construction, partial transfer of construction-phase risk, and the ability to defer upfront borrowing impacts on public balance sheets.⁹ Possibly influenced by the outsourcing trend as well.
This paper does not argue the narrow construction-phase outcomes. It examines what happens after financial close—when the PPP contract is signed and the private-partner takes control—across 25 to 35-year contract operating periods. During this time higher capital costs, reduced flexibility, and contractual rigidity compound into measurable capacity loss.
Under these arrangements, a private consortium designs, builds, finances, and maintains the hospital facility for the term of the contract. In return, the public-sector commits to fixed availability payments, which function as long-term capital repayment bundled with maintenance and lifecycle services.¹⁰
These payments are contractual minimum obligations. They typically escalate with inflation and any changes, upgrades, or reconfigurations required are extras.
What Are the Consequences?
Independent audits—most notably from provincial Auditors General and corroborated by international public-sector reviews—consistently find these project models carry a material cost premium relative to traditional public procurement and financing.¹²¹³
Across the jurisdictions and over time, that premium averages ~ 26 percent.¹⁴ This is a conservative figure based on audited public-sector comparators and not advocacy estimates. You can find its derivation including component cost drivers and audit sources in Appendix B2.
The direct results of this 26 percent premium:
The same public expenditure produces fewer beds with the private-partner delivery model. Simply stated: three beds for the cost of four. Or on the scale we are talking about for our healthcare network nationwide. Three hospitals for the cost of four.
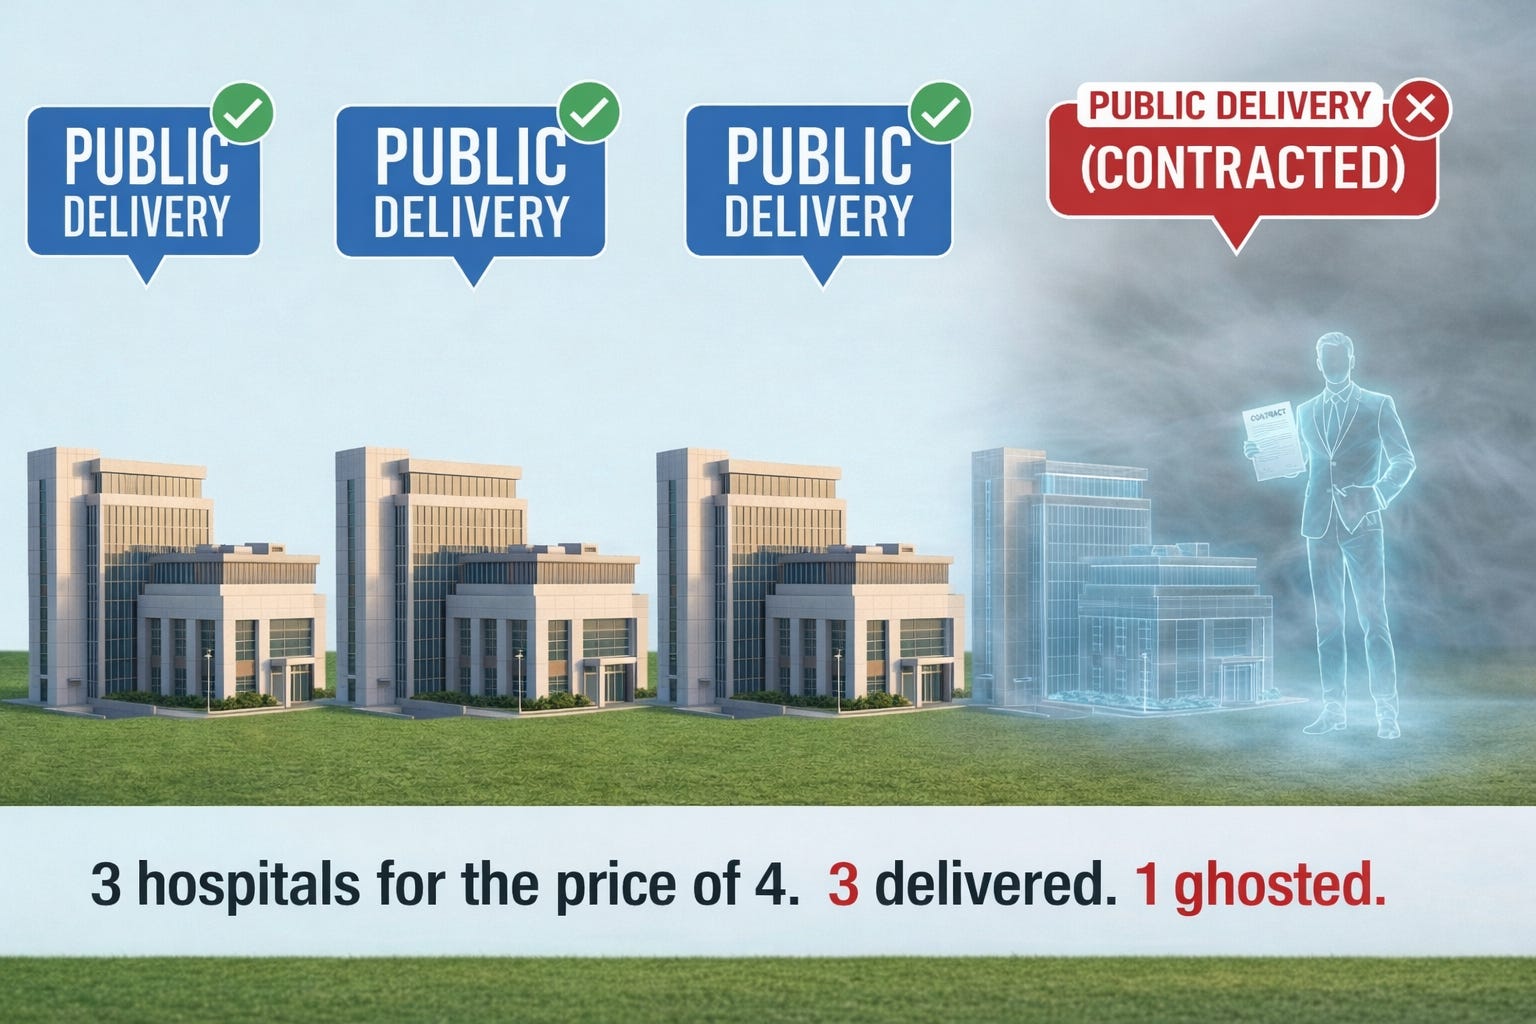
Simply stated: Private partnerships result in building three hospitals, for the cost of four.
About 1,300~1,500 beds could have existed today but do not, based on the roughly 5,000~6,000 beds delivered or committed to date.¹⁵ Patient care would be better. For doctors, nurses, and support staff these missing beds might have mitigated 'hallway medicine' and moral distress.
This is equivalent to the total bed capacity of 3 or 4 major Canadian hospitals simply missing from our system today. Or nearly a dozen community hospitals.
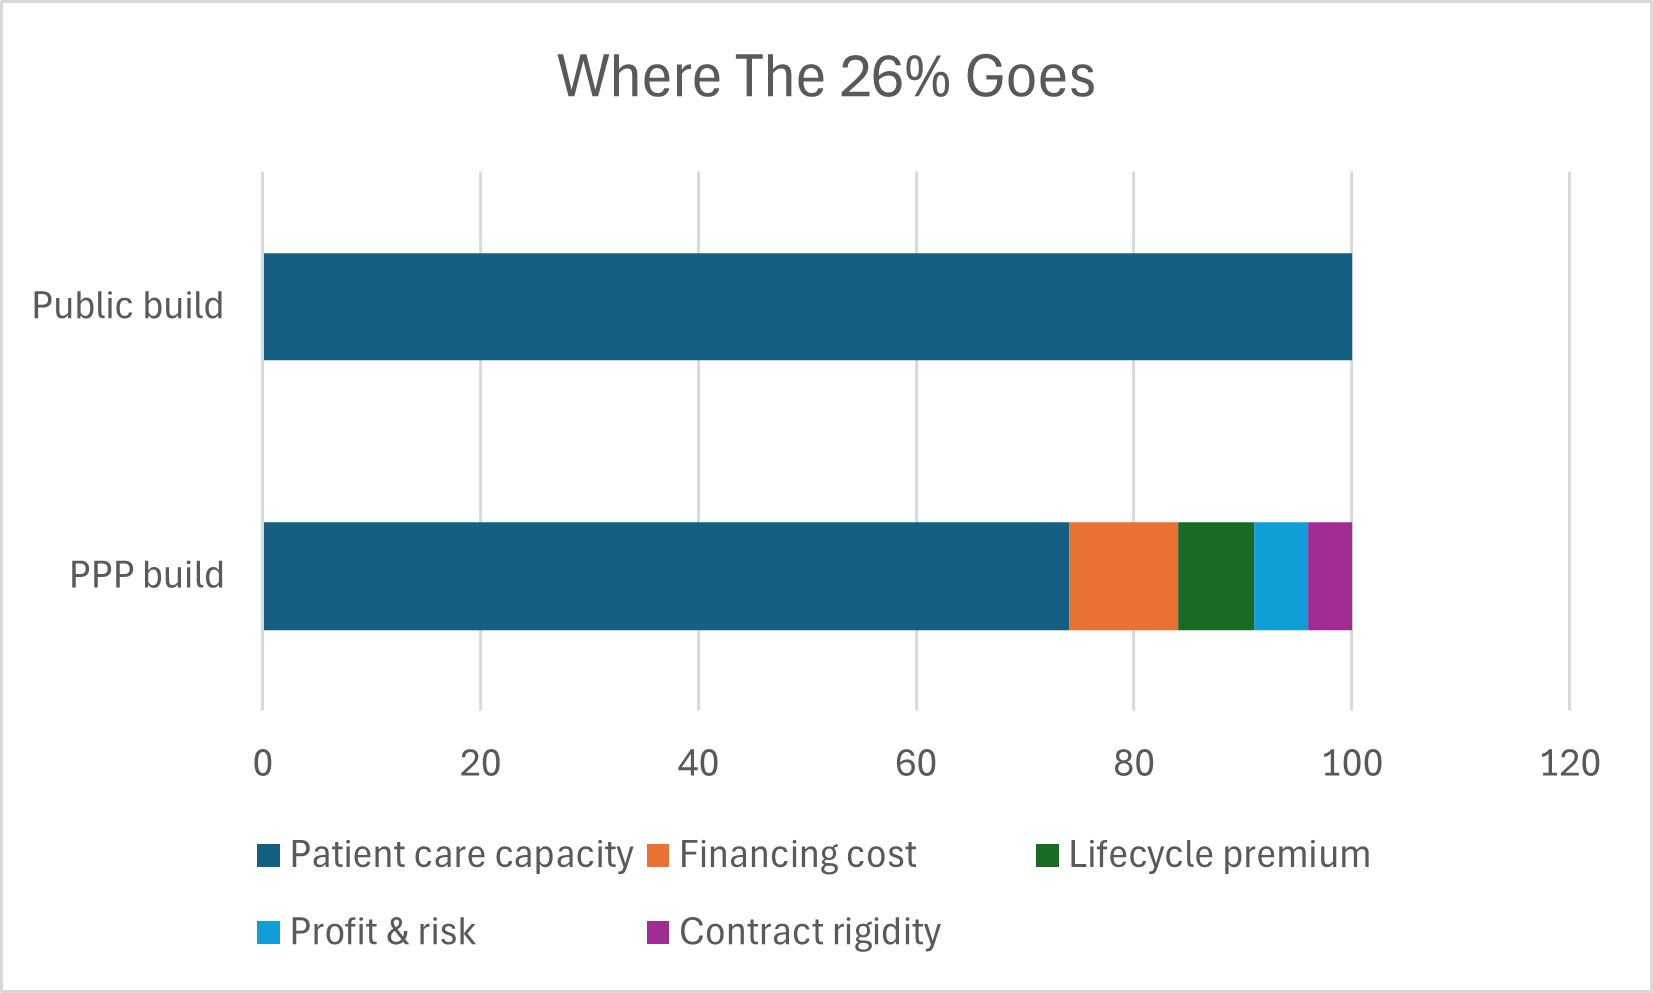
Comparison of how $100 of public health expenditure is allocated under conventional public hospital delivery vs private-partner delivery, showing the 26% premium extracted by financing, lifecycle, profit, and rigidity costs.
These are not hypothetical beds. They represent the difference between what was built and what could have been built with the same funding under conventional public delivery and financing.
This is the first and most literal source of what this paper terms “ghost beds.”
They were never built.
First And Foremost: Availability Payments
Conventional public delivery funds and finances hospital capital costs from provincial and indirectly, federal funds. This is done via separate accounts and not annual hospital operating budgets.
Once construction is complete, ongoing healthcare funding flows primarily toward staffing, services, and day-to-day operations rather than repayment of construction capital.¹⁶
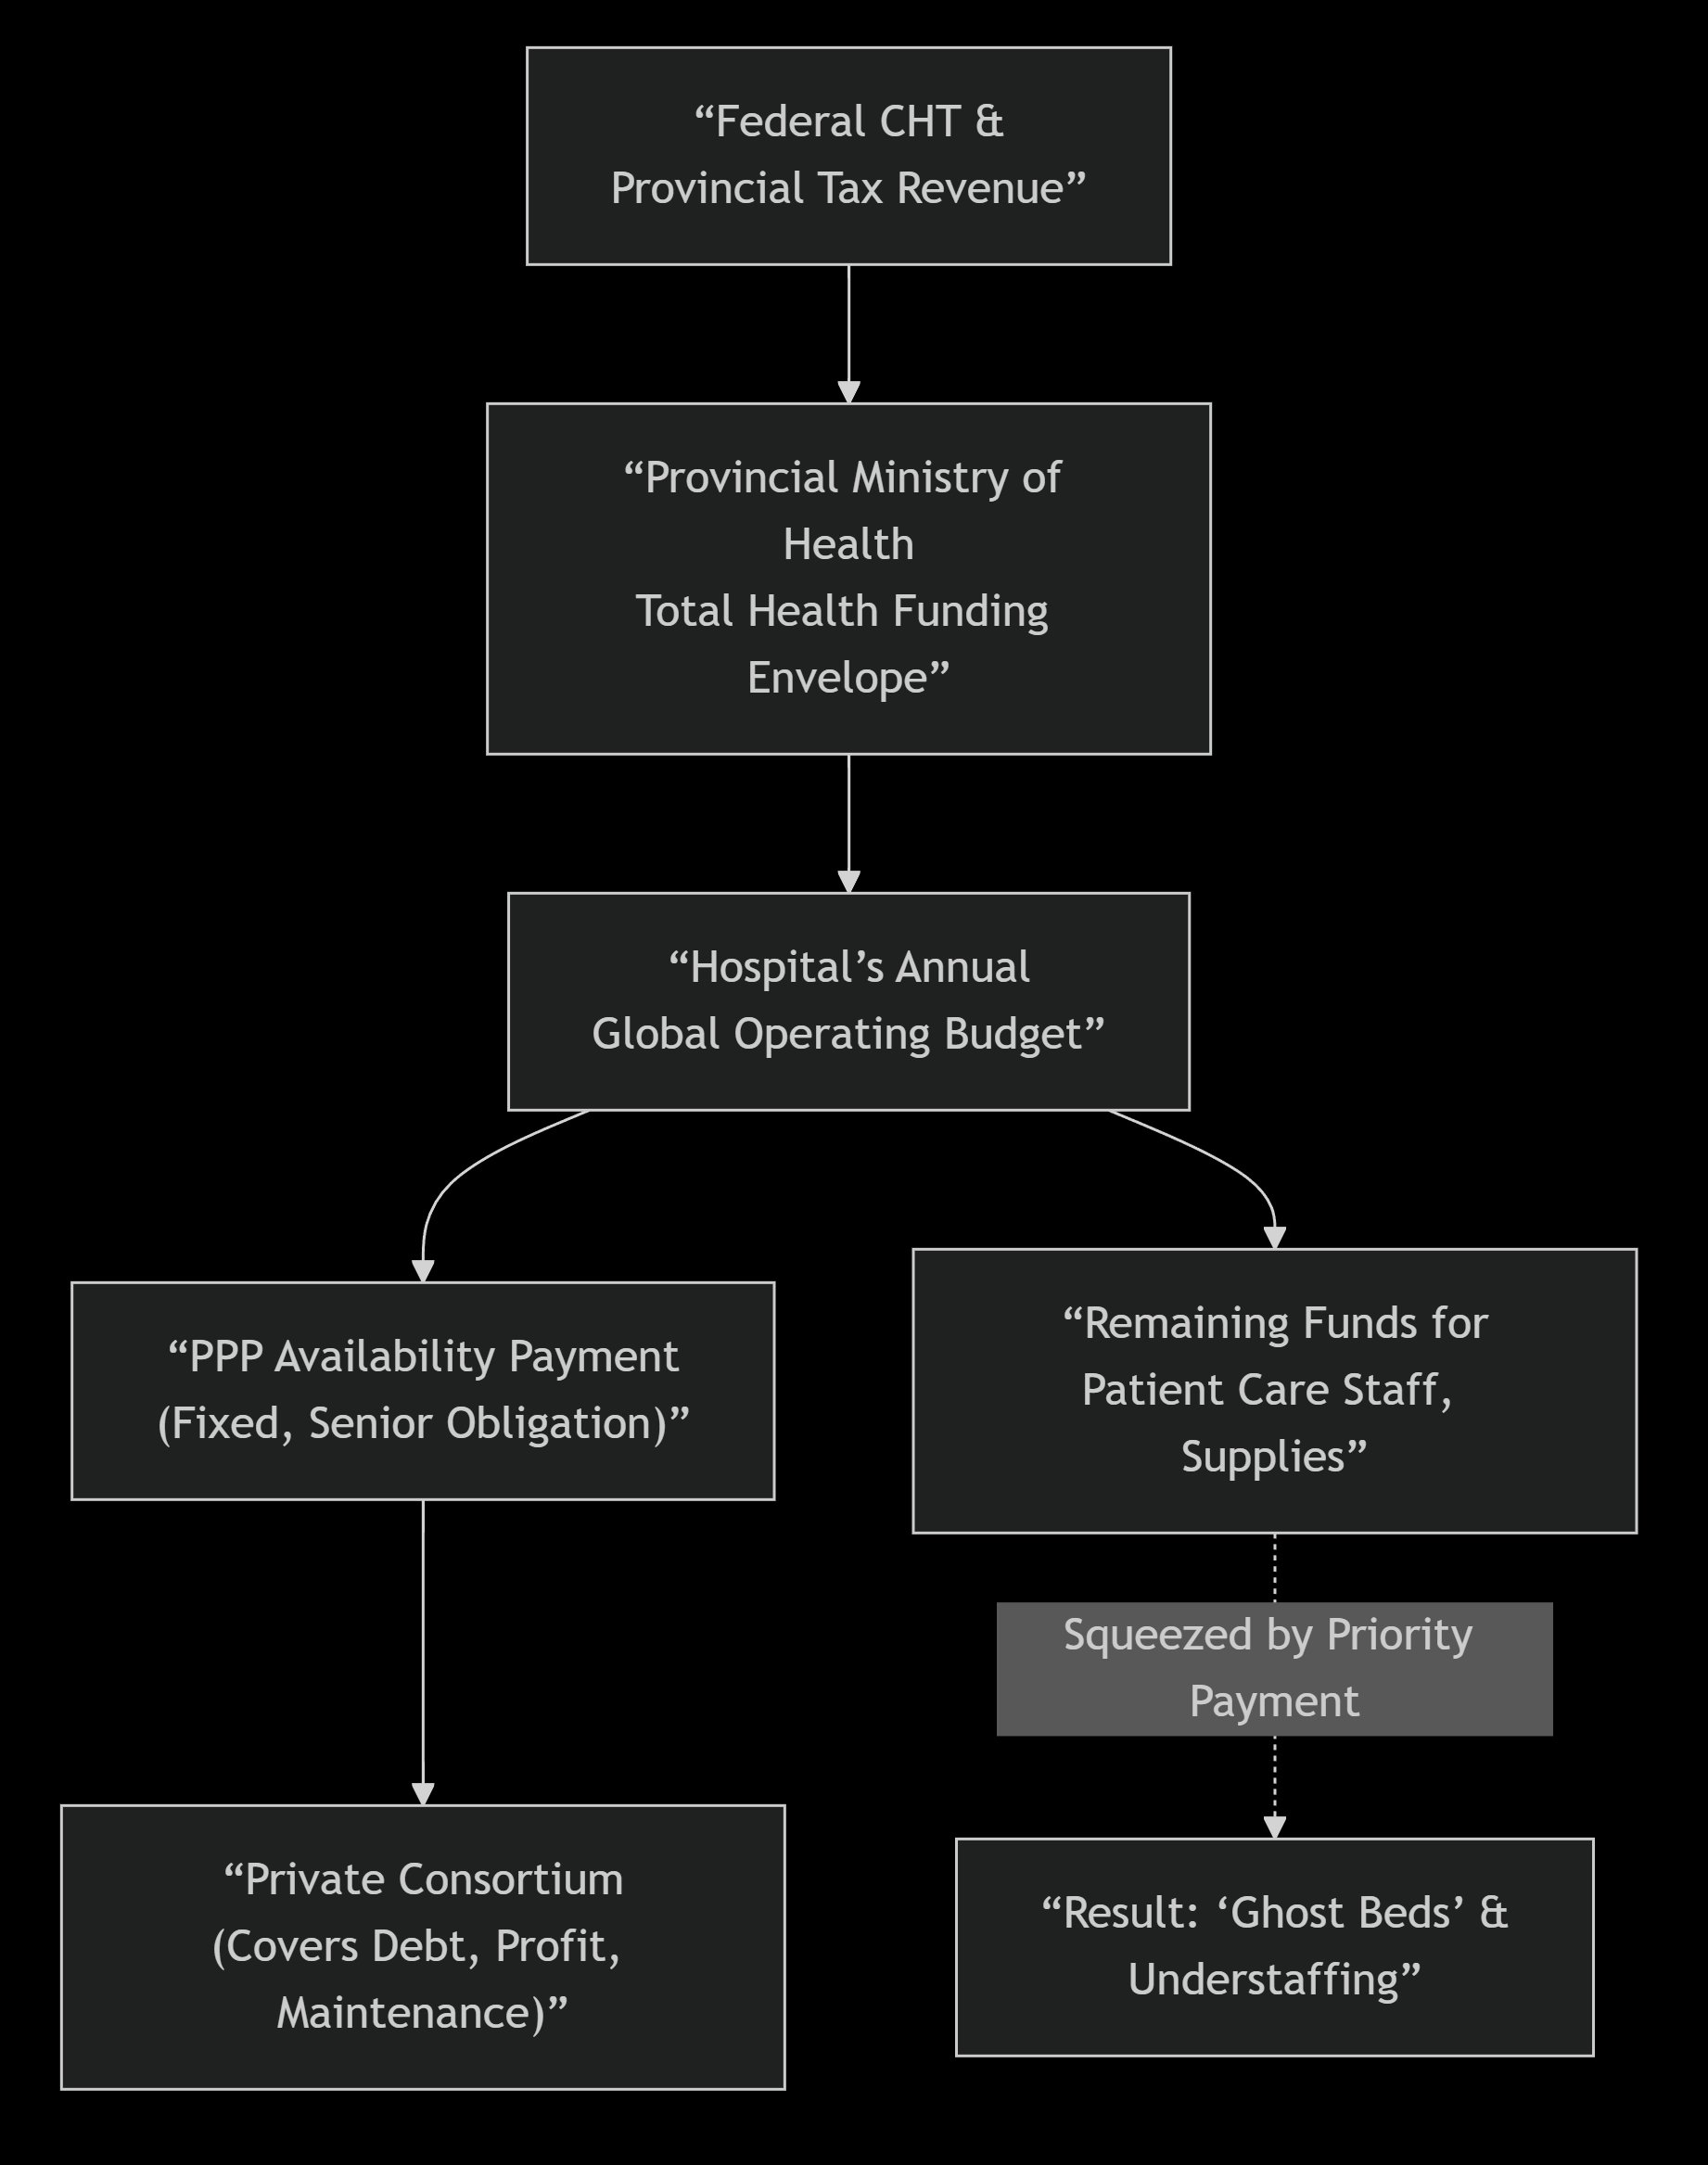
Private-partner delivery on the other hand embeds long-term capital repayment into the health-sector funding framework via monthly availability payments. The payment obligation is not optional; these are senior ranking obligations and must first be met in full.¹⁷
While these are provincial payment obligations rather than hospital invoices, they become fixed recurring claims on health-sector fiscal room, reducing discretionary capacity available for staffing, services, and surge funding.¹⁸
Compare this to conventional delivery where there are no availability payments to take up operating fiscal room, nor any interest payments on related government borrowing for construction capital.
When health budgets tighten—as they inevitably do—adjustments can only be made in discretionary areas. Availability payments cannot flex.¹⁹ So therefore the staffing, funded beds, overtime, and surge capacity must flex.
The most significant 'variable' cost left to cut is people. This potentially forces nurses into higher patient ratios and doctors into fragmented care models, trading long-term staff retention for short-term contractual compliance.
Caption: Availability payments are fixed, senior obligations. When funding is constrained, adjustment occurs only on the operating side.
Additional non-numeric mechanisms through which private-partner delivery effectively reduces capacity are documented in Appendix C3.
In a budget crunch, a hospital administrator cannot negotiate with the private partner's bank; they can only reduce the number of nurses on the floor.
These beds physically exist, yet remain unavailable in practice—unfunded, unstaffed or understaffed.²⁰
This is another form of ghost bed.
Rigid Contracts Compound Crisis
Private-partner hospital contracts do not explicitly prohibit operating at high occupancy. However, facilities are designed, priced, and contracted around a projected level of use—typically a sustained 80–85 percent occupancy.²¹
Physical systems are engineered to those levels—HVAC, medical gases, electrical capacity, support spaces.
When hospitals must operate at 95 percent or higher for extended periods, as occurred during COVID-19, wear accelerates, maintenance cycles shorten, and lifecycle costs rise materially.²²
Under private-partner contracts, these costs become change orders, compensation events, or disputes, recoverable by the partner with margins and markups.²³ The private-partner has not priced those in, and will seek to be kept whole with administrative costs and profit premiums.
Surge capacity is therefore not prohibited—but it becomes slower, more expensive, and harder to sustain precisely when patients need it most.
Flexibility Lost
Once contracts reach financial close, and the private-partner begins to build and operate the hospital infrastructure:
Competitive pricing is structurally constrained
Pricing mostly occurs inside a contractual “black box”
Public authorities have limited ability to benchmark or challenge costs in real time²⁴
As a practical matter, the public is in the hands of the private-partner. Comparable situations and pricing independently are challenging.
No Canadian PPP hospital project agreement has been publicly released in full, including the detailed operating obligations, penalty regimes, abnormal-usage provisions, and lifecycle pricing schedules.
Public disclosure is limited to high-level summaries and heavily redacted contracts. Key commercial schedules governing lifecycle pricing, risk assumptions, and internal transfer pricing are routinely redacted from public contracts.²⁵
The only mechanism to penetrate this opacity is dispute resolution or litigation—slow, expensive, and impractical during live hospital operations or emergencies.²⁶
The ownership, control, and information asymmetries driving this flexibility loss —and why pricing and decision-making move into a “black box” after financial close—are examined more deeply in Appendix D4.
After repeated friction resolving black box issues the rational human response is of future avoidance. And as a consequence, flexibility to readily and cost effectively address patient needs further erodes.
The larger the issue, the more money and intensity around resolutions. Challenges with this sole source black box delivery impact all aspects, including hospital network planning and management, renovations large and small, additions, expansions, and reconfigurations.
Public plans to address changing needs may be delayed, hampered in scale or scope or abandoned.
Large infrastructure projects such as the Eglinton Crosstown LRT illustrate how multi-party contractual structures can devolve into years of delay once disputes arise inside long term, risk-allocation contracts.
While transit delays impose inconvenience, similar dynamics in hospital infrastructure have materially higher stakes. Patients cannot wait for arbitration.
Payments Are Protected, Patients Are Padding
Canada is not capital-constrained. Provinces borrow at materially lower rates than private consortia, and Canada’s sovereign borrowing costs are among the lowest in the G7.²⁷
Yet private-partner delivery redirects healthcare dollars toward higher financing costs, lifecycle premiums, administrative charges, and profit margins—rather than patient care. Private partners’ objectives are solely commercial and different from the public’s objectives for patient care. This is commerce, not malice.
Availability payments insulate the asset from fiscal and physical stress. Yet staffing and services are not protected. Beds appear in plans and official counts. Gleaming buildings stand. Staffing, operations, and surge capacity flex and fall short. Stressed staff, distressed patients fall behind.
These are the ghost beds of Canada’s hospital system.
Joseph Brant Hospital: A modern facility where the ‘Ghost Bed’ dynamic—physical space vs. operational funding—plays out in real-time. Source: Joseph Brant Hospital Foundation
What Evidence Shows
Taken together, the evidence shows private-partner delivery capacity impacts are neither incidental nor temporary.
The capital and operating cost premium for such projects is real, auditable and enduring.
They create a structural squeeze on operating staff and patient care too, as fixed availability payments take priority over care when budgets tighten.
Over multi-decade contracts, reduced flexibility compounds the effects by making change slower and more expensive precisely when healthcare most needs to adapt.
The flexibility to manage Canada’s healthcare delivery network is hampered too. Compounding over time.
The “Ghost beds” result is the predictable outcome of delivery choices made every day, not accidental: fewer beds built, and fewer of those beds available in practice. And it hampers professional care efforts as patient needs and healthcare practice and technology changes.
What Comes Next
Right now, Canada has thousands of additional hospital beds in planning, procurement, or early development where private-partner delivery choices have not yet been locked in.²⁸
If these projects proceed using the same private-partner delivery structures—then the same conservative 26 percent premium applies—and Canada risks forgoing another 1,300~1,500 beds for the same public expenditure.²⁹ You can find some of these projects and their potential healthcare capacity loss in Appendix E5.
This is not an abstract future risk. The choice is not just fiscal — it’s generational. And it’s being made right now.
About the Author
The author spent more than three decades working inside a large multinational organization responsible for planning, financing, building, and operating its complex networks of physical assets.
This included direct-owned infrastructure, joint ventures analogous to public-private partnerships, and specialized facilities such as operational hubs and data centres.
The author’s experience included direct participation in the design, structuring, financing, and long-term operation of large asset portfolios, rather than advisory or academic roles.
The observations in this paper reflect both publicly available audit evidence and practical experience with how long-term contractual infrastructure arrangements behave under operational stress.
Appendices & Methodology
The following footnotes and appendices document the evidence, methodology, and structural mechanisms underlying the analysis in this paper. Together, they separate what is already locked in from what remains a policy choice, and distinguish documented minimum outcomes from conservative system-level estimates used in the main text.
Appendix A - Built PPP projects. The locked-in loss.
Appendix B - Cost premium. The methodology.
Appendix C - Operational effects. The structural constraints.
Appendix D - Opacity and the “Black Box”. Irreversible rigidity, thwarts flexibility.
Appendix E - Current pipeline of hospitals. Capacity at risk.
Footnotes & Primary Sources
Note for readability: Appendices A through E are referenced in the paper’s text with larger footnote numbers in sequence 1 through 5. If you hover over these larger numbers for the related Appendix should become visible, readable and scrollable at the point where you hover. To save from have to scroll away from where you are at in your reading.
The following institutional sources provide the data for the audit-based findings:
Auditor General Reports: Comprehensive reviews from Ontario, British Columbia, and Québec regarding cost premiums and contract rigidity.
International Corroboration: Evidence from the UK National Audit Office and Australian National Audit Office regarding lifecycle cost overruns and “black box” pricing.
Fiscal Mechanics: Federal transfer mechanics and statutory floors from the Department of Finance Canada and the Federal–Provincial Fiscal Arrangements Act.
System Performance: Occupancy and capacity standards from the Canadian Institute for Health Information (CIHI) and the Ontario Financial Accountability Office (FAO).
All numeric estimates are based on public audit findings and conservative assumptions. Where calculations are original, they are explicitly identified as such.
1. Auditor General of Ontario — Alternative Financing and Procurement (AFP)
Supports: Cost premium; limits of risk transfer; long-term payment obligations
Source:
Office of the Auditor General of Ontario, Infrastructure Ontario—Alternative Financing and Procurement
2. Auditor General of British Columbia — Health Infrastructure P3s
Supports: Lifecycle cost escalation; contract rigidity; benchmarking limits
Source:
Office of the Auditor General of British Columbia, Private Partnerships in Health Infrastructure
https://www.oag.bc.ca/app/uploads/sites/963/2024/08/OAGBC-2011-05-02-OAGBC-P3-Report-May-2011.pdf
3. Auditor General of Québec — Hospital PPPs
Supports: Comparative cost outcomes; opacity of contracts; lifecycle pricing
Source:
Vérificateur général du Québec, Les partenariats public-privé dans le secteur de la santé
URL (French, official):
https://www.vgq.qc.ca/Fichiers/Publications/rapport-annuel/2009-2010-T2/fr_Rapport2009-2010-T2.pdf
Chapter 5: Discusses PPPs in the context of health infrastructure (e.g., CHUM/MUHC projects), cost comparisons, risk transfer, and financing premiums.
Chapter 6: Covers related vigie (monitoring) of the Quebec health dossier, including PPP implications.
It contains sections on:
PPP cost premiums (e.g., higher private financing vs. public).
Risk transfer evaluations.
Specific health project references (CHUM, MUHC).
Alternative archived version (same content):
https://fsss.qc.ca/wp-content/uploads/2024/06/rapport2009-2010-t2-chap05-2.pdf
Summary of Relevant Content (from the 2009-2010 Report)
The report critiques PPPs in Quebec health projects, noting:
Higher financing costs (private borrowing vs. public).
Risk transfer often overstated in value-for-money analyses.
Lifecycle costs and change orders can add significant premiums (aligning with your 20–30% range).
Examples from CHUM and MUHC show premiums due to private equity returns and bundled maintenance.
4. Infrastructure Ontario — Value for Money (VFM) Methodology
Supports: Definition of “premium”; Public Sector Comparator methodology
Source:
Infrastructure Ontario, Assessing Value for Money
URL:
Assessing Value for Money: A Guide to Infrastructure Ontario's Methodology (PDF)
5. UK National Audit Office — PFI / Hospital Projects
Supports: International corroboration; lifecycle cost overruns; inflexibility
Source:
UK National Audit Office, PFI and PF2
URL: https://www.nao.org.uk/reports/pfi-and-pf2/
6. Australian National Audit Office — Public-Private Partnerships
Supports: International evidence; change-order and risk-pricing failures
Source:
Australian National Audit Office, Public Private Partnerships
7. Canada Health Transfer — Allocation Formula
Supports: Per-capita allocation; no adjustment for costs or demographics
Source:
Government of Canada, Canada Health Transfer
URL:
https://www.canada.ca/en/department-finance/programs/federal-transfers/canada-health-transfer.html
8. Federal–Provincial Fiscal Arrangements Act
Supports: GDP escalator; 3% statutory floor; mechanics of federal transfers
Source:
Justice Canada, Federal–Provincial Fiscal Arrangements Act
URL:
https://laws-lois.justice.gc.ca/eng/acts/F-8/
9. Government of Canada — 2023–2028 Health Funding Top-Up
Supports: Temporary 5% CHT guarantee; proof that formula alone is insufficient
Source: Department of Finance Canada, Working Together to Improve Health Care for Canadians
10. Department of Finance Canada — Federal Transfer Payment Mechanics
Supports: Payment schedule; estimate and reconciliation process
Source:
Department of Finance Canada, Federal Transfers to Provinces and Territories
URL: https://www.canada.ca/en/department-finance/programs/federal-transfers.html
11. Ontario Financial Accountability Office — Health Sector Spending
Supports: Fiscal room constraints; operating pressures; staffing as adjustment margin
Source: FAO of Ontario, Ontario Health Sector: Spending Plan Review
12. Infrastructure Ontario — AFP Model Overview and Auditor General of Ontario — Infrastructure AFP Audit
Supports: Availability payments; bundling of capital, maintenance, lifecycle costs
Source: Infrastructure Ontario, Alternative Financing and Procurement (AFP)
https://www.infrastructureontario.ca/en/what-we-do/major-projects/our-p3-model/
https://www.auditor.on.ca/en/content/annualreports/arreports/en14/305en14.pdf
13. Canadian Institute for Health Information (CIHI) — Hospital Beds & Occupancy
Supports: Occupancy norms (80–85%); system stress above 90–95%
CIHI, Hospital Beds and Occupancy
URL:
https://www.cihi.ca/en/indicators/hospital-occupancy-rate
14. Healthcare Facilities Engineering — Lifecycle Stress
Supports: Accelerated wear under sustained high occupancy
Source:
ASHRAE, Healthcare Facilities Guidance
URL:
https://www.ashrae.org/technical-resources/healthcare
15. Infrastructure Ontario — Commercial Confidentiality & Disclosure
Supports: Redaction practices; limits on benchmarking and transparency
Source:
Infrastructure Ontario, FAQ – Commercial Confidentiality
16. Ontario Budget 2024 — Hospital Capital Pipeline
Supports: Scale of upcoming hospital projects
Source:
Government of Ontario, 2024 Budget – Building Ontario
URL:
https://budget.ontario.ca/2024/chapter-1b.html
17. British Columbia — Health Capital Projects
Supports: National scope of pipeline beyond Ontario
Source:
Government of British Columbia, Health Capital Projects
URL:
https://www2.gov.bc.ca/gov/content/health/about-bc-s-health-care-system/health-capital-projects
18. Author Calculations and Synthesis
Supports:
~1,800 beds foregone (historic)
~1,800 beds at risk (forward pipeline)
Basis:
Synthesis of audited PPP cost premiums (Sources 1–6) applied to publicly disclosed bed counts and capital project scopes (Sources 16–17). Full methodology described in Appendix D.
19. Appendices A, through E follow
These appendices are referenced in the paper’s text with larger footnotes in sequence 1 through 5. If you hover over the number for each in the paper, they should be readable at the point where you hover. To save from scrolling.
Appendix A - Built PPP projects. The locked-in loss.
Canada’s Completed or Financial-Close Hospital Projects Delivered via Private-Partner Models
Purpose of This Appendix
This appendix documents Canadian hospital projects that have reached financial close under private-partner delivery models (PPP / AFP / DBFM).
Its purpose is threefold:
To ground the paper’s central claim in completed, irreversible outcomes
To present a conservative, auditable minimum based only on projects with clearly documented inpatient bed counts
To translate documented cost inefficiency into lost healthcare capacity, expressed in beds
Once financial close is reached, the delivery structure, financing terms, and lifecycle obligations are effectively locked in for decades, regardless of future system needs or fiscal conditions. These projects therefore represent actual system outcomes, not projections.
This appendix intentionally understates total system exposure. It excludes:
Phased projects without clear inpatient bed disclosure
Partial redevelopments with mixed scopes
Projects still in procurement or early construction
Totals should therefore be read as a lower bound, not a full census.
Methodological Note
Independent public audits consistently find that private-partner hospital delivery carries an average capital and lifecycle cost premium of approximately 26% relative to conventional public delivery and public financing.
To express this inefficiency in capacity terms, this appendix applies that conservative average to estimate “public-equivalent beds foregone” — that is, how many additional inpatient beds could reasonably have been delivered for the same fixed public funding under traditional public delivery.
This method:
• Does not assume higher budgets
• Does not rely on hypothetical spending
• Reflects how capital envelopes are actually set in practice
(Full derivation of the ~26% figure is documented in Appendix B.)
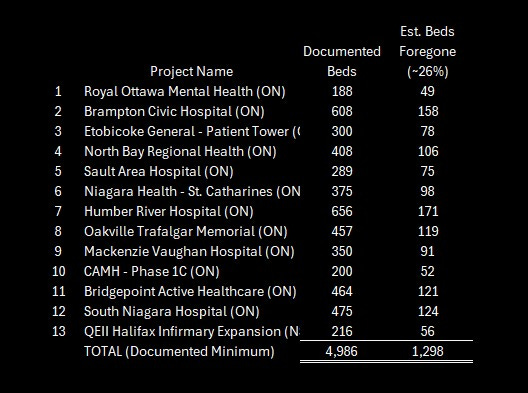
Based on a conservative ~26% delivery premium, the following table illustrates the "public-equivalent beds" that could have been delivered for the same funding under traditional public procurement.
Details and Links of Projects Included (Financial Close Reached)
Royal Ottawa Mental Health Centre — Ottawa, Ontario
Beds (project scope): 188
Estimated public-equivalent beds foregone (~26%): 49
Source: Infrastructure Ontario
https://kelson.on.ca/projects/project/566
Brampton Civic Hospital — Brampton, Ontario
Beds: 608
Estimated beds foregone: 158
Source: Ontario Auditor General — AFP Review
https://www.auditor.on.ca/en/content/annualreports/arreports/en14/305en14.pdf
Etobicoke General Hospital — Patient Care Tower — Toronto, Ontario
Beds: 300
Estimated beds foregone: 78
Source: Lexpert, Axium, Supply Professional
https://www.axiuminfra.com/wp-content/uploads/2016/12/EN_2016-06-13-Press-Release-Etobicoke_May-2016_website-only_en.pdf
https://www.infrastructureontario.ca/en/what-we-do/projects/etobicoke-general-hospital/
https://www.supplypro.ca/contract-awarded-etobicoke-general-hospital-redevelopment/
North Bay Regional Health Centre — North Bay, Ontario
Beds: 408
Estimated beds foregone: 106
Source: Infrastructure Ontario, Plenary
https://www.infrastructureontario.ca/en/news-and-media/news/north-bay-regional-health-system/cost-of-new-north-bay-hospital-competitive-and-fair/
https://plenary.com/americas/project/north-bay-regional-health-centre
Sault Area Hospital — Sault Ste. Marie, Ontario
Beds: 289
Estimated beds foregone: 75
Source: Infrastructure Ontario
https://www.infrastructureontario.ca/en/what-we-do/projects/sault-area-hospital/
Niagara Health — St. Catharines Site — St. Catharines, Ontario
Beds: 375
Estimated beds foregone: 98
Source: Infrastructure Ontario
https://www.infrastructureontario.ca/en/what-we-do/projectssearch/niagara-health-system/
Humber River Hospital — Toronto, Ontario
Beds: 656
Estimated beds foregone: 171
Source: Nova Scotia Federation of Labour, Humber River Hospital, Plenary
https://nslabour.ca/1225/
https://www.pcl.com/ca/en/our-work/humber-river-hospital
https://plenary.com/project/humber-river-hospital
Oakville Trafalgar Memorial Hospital — Oakville, Ontario
Beds: 457
Estimated beds foregone: 119
Source: Ellis Don, Torys
https://www.ellisdon.com/project/oakville-trafalgar-memorial-hospital
https://www.torys.com/work/2011/07/9dbe27e2-e31a-45ba-96ea-9ada723714ef
Mackenzie Vaughan Hospital — Vaughan, Ontario
Beds: 350
Estimated beds foregone: 91
Source: Cortellucci Vaughan Hospital, PCL
https://plenary.com/project/cortellucci-vaughan-hospital
https://www.pcl.com/ca/en/our-work/cortellucci-vaughan-hospital
Centre for Addiction and Mental Health (CAMH) — Phase 1C — Toronto, Ontario
Beds: 200
Estimated beds foregone: 52
Source: Infrastructure Ontario
https://www.infrastructureontario.ca/en/what-we-do/projectssearch/centre-for-addiction-and-mental-health-camh-phase-1b/
Bridgepoint Active Healthcare — Toronto, Ontario
Beds: 464
Estimated beds foregone: 121
Source: Infrastructure Ontario https://www.pcl.com/ca/en/our-work/bridgepoint-active-healthcare
South Niagara Hospital — Niagara Region, Ontario
Beds: 475
Estimated beds foregone: 124
Source: Infrastructure Ontario
https://www.infrastructureontario.ca/en/what-we-do/projectssearch/south-niagara-hospital/
QEII Halifax Infirmary Expansion — Halifax, Nova Scotia
Beds: 216
Estimated beds foregone: 56
Source: Build Nova Scotia
https://buildns.ca/healthcare/hiep/
Appendix A Summary
Hospital beds delivered or contractually committed (documented minimum): ~5,000
Public-equivalent beds foregone due to delivery premium (~26%): ~1,300
Status: Structural and irreversible once contracts are signed
These foregone beds do not appear elsewhere in the system.
They were never built.
Private-partner hospital delivery produces roughly three beds for the cost of four.
Appendix B - The ~26% premium methodology.
Purpose of This Appendix
This appendix documents how the approximately 26% capital and lifecycle cost premium associated with private-partner hospital delivery is derived.
The figure is audit-based, conservative, and corroborated internationally. It is not a worst-case estimate.
While PPPs are often justified on the basis of risk transfer, multiple Auditor General reviews find that significant portions of this risk are priced conservatively up front and later mitigated through contract variations, limiting the realized benefit to the public sector.
In summary, the cost differential is derived from four primary components observed across independent public audits:
Financing Cost Differential (≈ 8–12%): The spread between low provincial borrowing rates (~2.5–4%) and PPP blended cost of capital (~6–8%+) over a 30-year term.
Lifecycle Maintenance Premium (≈ 6–8%): Risk-priced maintenance allowances and conservative replacement schedules embedded in long-term contracts.
Profit and Risk Margin (≈ 4–6%): Equity returns and bid premiums that are often not fully realized as public benefits.
Change-Order/Rigidity Premium (≈ 4–6%): Documented 20–50% premiums on contract variations due to sole-source control after financial close.
B1. What the 26% Represents
The 26% figure represents the additional public cost incurred when hospitals are delivered through PPP models rather than direct public procurement and public financing.
It includes higher financing costs, private profit and equity returns, elevated lifecycle maintenance allowances, and risk-priced costs arising from long-term contractual rigidity (including change-order pricing and limited post-close competition).
It excludes staffing shortages, physician availability, and pandemic emergency spending.
B2. Components of the Cost Differential
Financing Cost Differential (≈ 8–12%)
• Provincial borrowing: ~2.5–4%
• PPP blended cost of capital: ~6–8%+
• Spread persists for 25–35 years
Sources:
Ontario Auditor General (2014, 2021)
https://www.auditor.on.ca/en/
Parliamentary Budget Officer — Federal Borrowing Costs
https://www.pbo-dpb.gc.ca
Lifecycle Maintenance Premium (≈ 6–8%)
PPP contracts embed conservative replacement schedules and long-term, risk-priced maintenance allowances. As contract durations extend, private partners face greater uncertainty around asset condition, regulatory change, and usage intensity; these risks are priced conservatively up front to protect returns, producing higher lifecycle costs than in comparable publicly delivered hospitals.
Source: Ontario Auditor General (2014) — News Release on Public–Private Infrastructure Costs
https://www.auditor.on.ca/en/content/news/14_newsreleases/2014news_3.05.pdf
Profit and Risk Margin (≈ 4–6%)
Includes equity returns, bid premiums, and risk pricing not fully realized in practice.
Sources:
UK National Audit Office — PFI and PF2
https://www.nao.org.uk/wp-content/uploads/2018/01/PFI-and-PF2.pdf
Change-Order and Rigidity Premium (Expected Value ≈ 4–6%)
Post-close sole-source control and limited price discovery produce documented 20–50% variation premiums internationally.
Sources:
UK NAO (2011, 2019)
https://www.nao.org.uk/wp-content/uploads/2011/06/Lessons-from-delivering-major-projects-through-PFI.pdf
B3. Aggregated Range and Working Estimate
Observed audit range: ~22–32%
Conservative midpoint used: ~26%
B4. Capacity Translation Logic
With a fixed $1.0B capital envelope:
• Public delivery produces X beds
• PPP delivery absorbs ~26% in non-care costs
• Result: ~26% fewer beds for the same public money
This is what underpins the “3 beds for the cost of 4” with PPP
B5. Why This Estimate Is Conservative
Excluded from the estimate:
• Litigation and disputes
• Pandemic or similar change orders
• Technology lock-ins
• Long-term opportunity costs
None are required to reach the stated premium.
Appendix B — References
These sources are independent, public, and institutional (Auditors General, Treasuries, World Bank, NAO). They consistently document the same structural cost components across jurisdictions and time periods.
D-1. Ontario Auditor General (2014)
Infrastructure Ontario — Alternative Financing and Procurement
Documents financing cost differentials, risk-transfer valuation, lifecycle premiums, and change-order rigidity in hospital AFP projects.
https://www.auditor.on.ca/en/content/annualreports/arreports/en14/305en14.pdf
B-2. Ontario Auditor General (2021)
Infrastructure Ontario: Follow-Up on Alternative Financing and Procurement
Confirms persistence of higher lifecycle costs and limited realized risk transfer in completed hospital PPPs.
Updated PDF Link: Procurement and Delivery of Selected Infrastructure Projects
Acute-Care Hospital Patient Safety and Drug Administration
https://www.auditor.on.ca/en/content/annualreports/arreports/en24/pa_infrastructureON_en24.pdf
https://www.auditor.on.ca/en/content/annualreports/arreports/en21/3-04MetrolinxLRTPAC_en21.pdf
B-3. UK National Audit Office (2018)
PFI and PF2
Finds public-sector borrowing materially cheaper than private finance and documents long-term cost premiums in hospital PFI projects.
https://www.nao.org.uk/wp-content/uploads/2018/01/PFI-and-PF2.pdf
B-4. UK National Audit Office (2011)
Lessons from Delivering Major Projects through PFI
Details monopoly pricing of change orders, capped penalties, and lifecycle rigidity in hospital PFIs.
https://www.nao.org.uk/wp-content/uploads/2011/06/Lessons-from-delivering-major-projects-through-PFI.pdf
B-5. UK National Audit Office (2019)
Managing the Relationship with the Private Sector in PFI Contracts
Documents 20–50% premiums on variations and change orders due to sole-source control by private consortia.
Direct Links
Full Report (PDF): https://www.nao.org.uk/wp-content/uploads/2011/04/1012920.pdf
Executive Summary (PDF): https://www.nao.org.uk/wp-content/uploads/2011/04/1012920es.pdf
Official Report Landing Page: https://www.nao.org.uk/reports/lessons-from-pfi-and-other-projects/
This document is a primary source for analyzing the UK’s experience with the Private Finance Initiative (PFI), which is the British equivalent of the P3 model. Key points relevant to infrastructure capacity and procurement include:
Efficiency and Savings: The report evaluates whether PFI achieved its goal of securing infrastructure cost savings and highlights where government oversight fell short.
Intelligent Customer Role: It emphasizes that for these partnerships to work, the public sector must act as an “intelligent customer,” possessing the commercial skills to negotiate and manage complex long-term contracts.
Debt Finance Costs: It notes that since the 2008 financial crisis, the cost of debt finance for these projects increased by 20% to 33%, calling into question the ongoing value for money of the private finance model.
B-6. Turner & Townsend (Annual)
International Construction Market Survey
Provides empirical benchmarks for construction cost escalation, risk pricing, and private-sector overheads.
Global construction market intelligence 2025 | Turner & Townsend
https://www.turnerandtownsend.com/en/perspectives/international-construction-market-survey/
B-7. Global Infrastructure Hub (World Bank / G20)
Managing PPP Contracts: A Practical Guide
Explains lifecycle cost loading, change-order economics, and long-term rigidity effects in PPP infrastructure. https://managingppp.gihub.org
B-8. Quebec Auditor General (2015–2019)
CHUM and MUHC Hospital Project Reports
Identifies financing premiums, contract rigidity, and cost overruns in Quebec hospital PPPs.
https://www.oag-bvg.gc.ca/internet/English/parl_lp_e_933.html
https://fsss.qc.ca/wp-content/uploads/2024/06/prod_deplicoalitonchu_angweb.pdf
https://iris-recherche.qc.ca/wp-content/uploads/2021/03/CHU-PPP-English-WEB.pdf
https://www.vgq.qc.ca/Fichiers/Publications/rapport-annuel/2008-2009-CHU/fr_Rapport2008-2009-CHU.pdf
B-9. Canadian Institute for Health Information (CIHI)
Health Care Cost Drivers in Canada
Provides baseline assumptions for public hospital capital and operating efficiency used in public-sector comparators.
https://www.cihi.ca/en/national-health-expenditure-trends
B-10. HM Treasury (UK)
The Green Book — Appraisal and Evaluation in Central Government
Sets the standard public-sector comparator methodology used to evaluate PPP cost premiums.
https://www.gov.uk/government/publications/the-green-book-appraisal-and-evaluation-in-central-government
B-11. World Bank Group (2020)
Public-Private Partnerships Reference Guide
Documents systematic financing and lifecycle cost premiums in large-scale PPP infrastructure. https://www.worldbank.org/en/topic/publicprivatepartnerships
B-12. Office of the Parliamentary Budget Officer (Canada)
Federal Borrowing Costs and Long-Term Debt Sustainability
Confirms Canada’s low sovereign borrowing costs relative to private finance benchmarks. https://www.pbo-dpb.gc.ca
Appendix C - Operational effects and constraints on surge capacity.
Purpose of This Appendix
This appendix documents non-numeric but material mechanisms through which private-partner (PPP / AFP / DBFM) hospital delivery reduces effective healthcare capacity beyond the upfront capital and lifecycle cost premium quantified in Appendix B.
Beyond capital costs, the “Ghost Bed” phenomenon is driven by structural rigidity:
Availability Payments: These fixed, senior-ranking monthly payments must be met before funds are allocated to staffing or care. When budgets tighten, care flexes while capital payments remain static.
Capacity Squeeze: Hospitals are engineered for 80–85% occupancy. Sustained operation at 95%+ (common during crises) accelerates wear and triggers expensive contractual change orders and lifecycle claims.
Performance Caps: Penalty regimes are often capped to protect lender confidence, meaning asset protection is contractually prioritized over operational resilience.
These mechanisms arise from contract structure, control rights, and financial priority rules once financial close is reached. They are observable in completed projects and documented in public audits in Canada and comparable jurisdictions.
C1. Availability Payments Prioritize the Asset, Not Care
Private-partner hospitals are paid through fixed “availability payments” — monthly contractual charges compensating the private consortium for making the building available and maintained to specification.
Key characteristics:
• Fixed and contractual
• Senior obligations
• Owed regardless of patient volume or system stress
• Escalate over time through indexation and lifecycle triggers
These payments must be made before funds are available for staffing, services, or surge capacity.
This does not prohibit patient care. It means that when budgets tighten, adjustment occurs on the operating side, not the capital side.
Source: Ontario Auditor General — Alternative Financing and Procurement Review (2014)
https://www.auditor.on.ca/en/content/annualreports/arreports/en14/305en14.pdf
C2. Operating Budgets Flex; Capital Obligations Do Not
Hospital operating budgets are inherently flexible:
• Staffing levels adjust
• Units consolidate or close
• Beds go unstaffed
• Elective procedures are deferred
Availability payments are not flexible.
This creates a structural asymmetry:
capital repayment is fixed; care delivery absorbs shocks.
Emergency departments become the visible pressure point because they are the system’s intake valve. When inpatient beds cannot be staffed, patients back up into the ER.
This is how “ghost beds” emerge — these beds physically exist, yet remain unavailable in practice—unfunded, unstaffed or understaffed.
Sources:
Ontario Auditor General (2014, 2021)
https://www.auditor.on.ca/en/content/annualreports/arreports/en21/1.06en21.pdf
CIHI — Hospital Capacity and Occupancy Reporting
https://www.cihi.ca/en/national-health-expenditure-trends
C3. Change Orders as a Structural Friction
Once financial close is reached, the private consortium controls the building.
Any material change — including ward reconfiguration, ICU expansion, ventilation upgrades, or technology integration — must proceed through a formal variation or change-order process.
In practice:
• Competitive pricing is constrained
• Variations are often sole-sourced
• Public owners cannot tender directly
• Benchmarking occurs inside a contractual “black box”
International public audits consistently document 20–50% premiums on PPP change orders relative to public works.
Sources:
UK National Audit Office — PFI and PF2 (2018)
https://www.nao.org.uk/wp-content/uploads/2018/01/PFI-and-PF2.pdf
UK National Audit Office — Managing the Relationship in PFI Contracts (2019)
https://www.nao.org.uk/reports/managing-the-relationship-to-secure-a-successful-partnership-in-pfi-projects/
C4. Surge Capacity and Accelerated Lifecycle Costs
PPP hospitals are designed and priced around assumed operating loads, typically 80–85% occupancy.
Sustained operation above those levels:
• Accelerates wear on HVAC, elevators, utilities, finishes
• Shortens maintenance cycles
• Triggers early component replacement
• Converts clinical urgency into contractual cost claims
During COVID-19, care was not prohibited — but it became contractually and financially expensive to sustain surge conditions.
Early burn-out costs do not disappear. They reappear as lifecycle claims, change orders, or disputes — with further markup for costs and profit margin.
Sources:
Global Infrastructure Hub — Managing PPP Contracts
https://managingppp.gihub.org/
Ontario Auditor General (2014) — Infrastructure Ontario: Alternative Financing and Procurement
https://www.auditor.on.ca/en/content/annualreports/arreports/en14/305en14.pdf
C5. Penalty Caps Protect Capital, Not Care
Performance-deduction regimes in PPP contracts are routinely capped to preserve lender confidence.
As a result:
• Financial exposure of private capital is limited
• Penalties rarely approach the social cost of failure
• Asset protection is prioritized over operational resilience
This is not a flaw in execution. It is a design feature of bankable infrastructure contracts.
Source: Ontario Auditor General — AFP Reviews
https://www.auditor.on.ca/en/content/annualreports/arreports/en14/305en14.pdf
Appendix C — Conclusion
Appendix C shows that:
• Capacity loss extends beyond upfront bed counts
• Operating flexibility is structurally constrained
• Crisis response becomes slower and more expensive
• Asset protection is contractually prioritized
These effects compound over decades and explain why ghost beds persist even where buildings exist.
Appendix D - Opacity and the “Black Box”. Irreversible rigidity, thwarts flexibility.
Purpose of This Appendix
This appendix explains why control and transparency degrade after financial close in PPP hospitals — even when procurement was competitive at the outset.
Most cost and capacity decisions typically occur after construction, not before.
D1. What Is Visible — and What Is Not
Typically visible:
• Lead constructors
• Project company name
• Some equity participants
Often not visible:
• Full equity ownership
• Limited partners in infrastructure funds
• Internal subcontracting
• Lifecycle pricing schedules
• Change-order markups
Sources:
Ontario Auditor General; Infrastructure Ontario project disclosures
https://www.infrastructureontario.ca/
https://www.auditor.on.ca/en/content/annualreports/annualreports.html
D2. Market Concentration After Financial Close
A small group of firms repeatedly appears across hospital PPPs, often in multiple roles.
Competition exists before award.
It weakens after financial close.
D3. Why “Market Testing” Often Fails
Even when variations are “market tested”:
• The private partner controls the process
• The public owner lacks price transparency
• Owner-led tendering is impossible
The result is a number, not a market.
Sources:
UK National Audit Office
https://www.nao.org.uk/reports/
D4. Why Control Tightens Over Time
Private control is commercially rational — the asset is lender collateral.
But it also produces:
• Slower change
• Higher cost
• Reduced adaptability
D5. Why This Reinforces the Inflexibility Premium
Over decades, this produces:
• Higher modification costs
• Longer timelines
• Reduced ability to reshape hospital networks
The issue is structure, not intent.
Summary of Structural Findings
Together, these appendices demonstrate that:
• The capital premium is real
• The operational squeeze is structural
• Flexibility loss compounds over time
• Ghost beds are predictable, not accidental
Appendix E - Current pipeline of hospitals. Capacity at Risk.
Purpose of This Appendix
This appendix illustrates exposure, not prediction. It shows what remains avoidable if delivery choices change before financial close.
This appendix identifies major Canadian hospital projects that have not yet reached full financial close and therefore do not yet have irreversible delivery structures and outcomes.
Unlike Appendix A, which documents losses already locked in, Appendix B exists to show what remains at risk — and what remains potentially avoidable.
The projects listed here represent the next decision point in Canada’s hospital infrastructure cycle. Delivery choices made prior to financial close will determine whether the capacity reductions documented in Appendix A are repeated — or corrected.
Methodological Note
For consistency with Appendix A and Appendix E, this appendix applies the same conservative ~26% delivery premium only as a conditional illustration of potential capacity loss if projects were delivered using private-partner (PPP / DBFM / AFP) models comparable to completed projects.
This appendix:
• Does not assert that all projects will be delivered via PPP
• Does not assume budgets will increase
• Does not treat these losses as inevitable
It shows exposure, not outcome.
Appendix E-1
Projects with PPP Delivery Stated, Procured, or Highly Likely (Pre-Financial Close)
These projects are either explicitly structured as PPPs or have advanced procurement features consistent with private-partner delivery, but are not yet fully complete and therefore are not included in Appendix A.
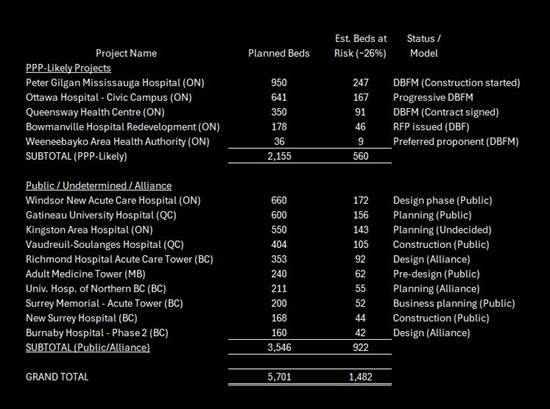
There are approximately 5,700 beds currently in the planning or early development pipeline.
PPP-Likely Projects: ~2,155 beds are already stated as PPP/DBFM, representing ~560 beds at risk.
Undetermined Projects: ~3,546 beds are in design or planning (e.g., Windsor New Acute Care, Gatineau University Hospital). If these move to PPP models, an additional ~920 beds could be foregone.
Peter Gilgan Mississauga Hospital — Ontario
Planned beds: ~950
Status: Construction started
Delivery model: DBFM (PPP) https://www.trilliumhealthpartners.ca/patientservices/m-site
Ottawa Hospital — Civic Campus — Ontario
Planned beds: ~641
Status: Early works / procurement
Delivery model: Progressive DBFM https://www.infrastructureontario.ca/en/what-we-do/projects/the-ottawa-hospital-civic-campus-redevelopment/ https://www.infrastructureontario.ca/en/what-we-do/projectssearch/the-ottawa-hospital--civic-campus-redevelopment-project/
https://newcampusdevelopment.ca/
Queensway Health Centre (Trillium Health Partners) — Ontario
Planned beds: ~350
Status: Contract signed
Delivery model: DBFM
Bowmanville Hospital Redevelopment — Ontario
Planned beds: ~178
Status: RFP issued
Delivery model: DBF (PPP)
https://www.lh.ca/about-us/our-future/redeveloping-the-bowmanville-hospital/
Weeneebayko Area Health Authority — Ontario (James Bay)
Planned beds: ~36
Status: Preferred proponent
Delivery model: DBFM
Source: Weeneebayko Area Health Authority
Subtotal (PPP-Likely Projects)
• Planned beds: ~2,155
• Public-equivalent beds at risk (~26%, illustrative): ~560
Appendix E-2
Projects in Planning or Early Development with Public, Alliance, or Undetermined Delivery
These projects are not currently structured as PPPs or are proceeding under public or alliance models, but are included here to illustrate system-scale exposure if delivery choices were changed prior to financial close.
Windsor New Acute Care Hospital — Ontario
Planned beds: ~660
Status: Design phase
Delivery model: Public
Source: Windsor Regional Hospital https://windsorstar.com/news/local-news/windsor-mega-hospital-expected-to-trigger-healthy-boost-to-local-economy
https://wrh.on.ca/AbouttheProject
https://www.wrh.on.ca/uploads/WEHSystem/WRH_PMO_Report_Jan2026.pdf
Gatineau University-Affiliated Hospital — Quebec
Planned beds: ~600
Status: Planning
Delivery model: Public
Source: Gouvernement du Québec
https://www.renewcanada.net/5000086139-2/
Vaudreuil-Soulanges Hospital — Quebec
Planned beds: ~404
Status: Under construction
Delivery model: Public
Source: CIUSSS Montérégie-Ouest
Burnaby Hospital Redevelopment — Phase 2 — British Columbia
Planned additional beds: ~160
Status: Design / construction
Delivery model: Alliance
Source: Fraser Health Authority
https://www.fraserhealth.ca/capital-projects/projects/burnaby-hospital#
Richmond Hospital Acute Care Tower — British Columbia
Planned beds: ~353
Status: Design development
Delivery model: Alliance
Source: Fraser Health Authority
https://www.vch.ca/en/richmond-hospital-redevelopment-project
University Hospital of Northern British Columbia — Patient Care Tower
Planned beds: ~211
Status: Planning
Delivery model: Alliance
Source: Northern Health
https://letstalk.northernhealth.ca/uhnbc
New Surrey Hospital — British Columbia
Planned beds: ~168
Status: Under construction
Delivery model: Public
Source: Fraser Health Authority
The new Surrey hospital and BC Cancer Centre - Fraser Health
Surrey Memorial Hospital — Acute Care Tower — British Columbia
Planned beds: ~200
Status: Business planning
Delivery model: Public
Source: Fraser Health Authority
https://news.gov.bc.ca/releases/2025INF0057-001207
Surrey Memorial Hospital acute care tower - Fraser Health
https://www.fraserhealth.ca/capital-projects
Health Sciences Centre — Adult Medicine Tower — Manitoba
Planned beds: ~240
Status: Pre-design
Delivery model: Public
Source: Shared Health Manitoba
https://sharedhealthmb.ca/news/2023-08-02-hsc-announcement/
https://news.gov.mb.ca/news/?archive=&item=46877
Kingston Area Hospital Redevelopment — Ontario
Planned beds: ~550
Status: Planning
Delivery model: Undecided
Source: Kingston Health Sciences Centre
Subtotal (Public / Alliance / Undetermined Projects)
• Planned beds: ~3,546
• Public-equivalent beds at risk (~26%, illustrative): ~920
Conditional Capacity Illustration
Total planned beds listed in Appendix B: ~5,700
If all projects listed in this appendix were delivered using private-partner hospital models consistent with Appendix A, an additional ~1,480 beds of public-equivalent capacity would be foregone for the same total public expenditure.
This is not a prediction.
It is a statement of exposure.
General Closing Note On Appendices
Appendix A shows what has already been lost.
Appendix B shows methodolgy for private partner cost premium
Appendix C shows operational effects beyond capital
Appendix D shows why operational effects can’t correct with time
Appendix E shows what does not yet have to be lost, if we choose to keep it.
Together, these appendices demonstrate that:
The capital premium is real and auditable
The operational squeeze is structural, not anecdotal
Flexibility loss compounds over time
“Ghost beds” are predictable outcomes of delivery choice, not accidents
This new piece, Ghost Beds — is about how we are structurally reducing healthcare delivery. It is the second part of a broader project examining how Canada’s healthcare system reached its current state — and what it will take to rebuild it.
Part I — Canada’s Healthcare “Crisis” — is about how far we fell behind
https://substack.com/@paulstewartii/p-182657291and looks at Canada's long arc of underbuilding, bringing us to today’s undeniable major capacity shortfall.
Part II (this article) focuses on the structural side: how financing and delivery models reduce the number of beds we get for the money we spend, and how those choices harden into long‑term constraints on care.
What comes next: The next section of this work will seek to outline a practical path forward. This is not going to be easy. We are in crisis mode, way below needed capacity, with our healthcare people, Doctors, Nurses, support staff, facilities are stressed.
So I will look across three horizons:
1. Short term: stabilizing capacity and managing out of this crisis.
2. Intermediate term: repositioning so the system can function without constant strain.
3. Long term: seizing an opportunity in the chaos, to use the best of the best, and renew our univeral care model. Moving us to the a leadership role in all things healthcare.
So a key goal is to connect these horizons into a coherent, realistic strategy — one that addresses the crisis honestly with deserving solutions. While also showing how Canada might travel a path from triage to full recovery.
This is a national conversation that needs to happen in the open, and thoughtful engagement helps sharpen the work. We are not only capable of it, we are worth it. Let's go.
I welcome and invite serious feedback, questions, and challenges.
Cheers
One doesn’t need to be a genius to realize that public-private partnerships will always be more expensive. The private portion needs to generate a financial profit and return on capital; the public portion’s return is simply the benefit the service provides. PPP has been an intellectual fraud since its inception. And those who state that the involvement of the private sector will lead to increased efficiency and therefore outweigh the profit extracted are simply nuts.